Copier Coller avec insertion ligne, masque des lignes vides
- Messages
- 4'199
- Excel
- 2021 FR 64 bits
- Inscrit
- 13/06/2016
- Emploi
- bénévole associations Goutte d'Or
Essayer cette modif :Nad89 a écrit :au niveau titre il créer des colonnes jusqu'à 16383
    Dim nb_lignes_visibles  As Integer, nb_colonnes As Integer
    With Sheets("Mouvements")
        With .ListObjects("Tableau22")
            .Range.AutoFilter Field:=2, Criteria1:="*" 'contient quelque chose
             .Range.AutoFilter Field:=14, Criteria1:="*->*" 'contient "->"
             .Range.SpecialCells(xlCellTypeVisible).Copy Sheets("Output").Range("A7")
            nb_colonnes = .Range.Columns.Count
            nb_lignes_visibles = .Range.SpecialCells(xlCellTypeVisible).Count / nb_colonnes
        End With
    End With
    With Sheets("Output")
        On Error Resume Next
        .ListObjects.Add(xlSrcRange, .Range("A7").Resize(nb_lignes_visibles, nb_colonnes), , xlYes).Name = "Tableau22"
        On Error GoTo 0
        With .ListObjects(1)
            .ShowTotals = True   'affichage ligne Total
             .ListRows.Add        'ajout 1igne vierge
             Ligne = .HeaderRowRange.Row + .ListRows.Count + 3   '2ème ligne libre après tableau
        End With
End With- Messages
- 4'199
- Excel
- 2021 FR 64 bits
- Inscrit
- 13/06/2016
- Emploi
- bénévole associations Goutte d'Or
Nad89 a écrit :J'ai un autre petit soucis est faire le totale dans ce tableau verticalement
essayer ce code avec modification de l'instruction LIgne = Ligne = Graphe(Ligne + TypesMut.Count + 1, ........
   'Calcul total par ligne et par Année
        j = 1
        For Each Item In TypesMut
            With Range(Cells(Ligne + j, 1), Cells(Ligne + j, 2))
                .Merge
                .Value = Item
            End With
            i = 3
            For Each Key In MutY.Keys
                With Cells(Ligne + 0, i)
                    .NumberFormat = "@"
                    .Value = ReduceMonth(Key & " " & Chr(160))
                    'un .NumberFormat="@" seul afficherait un warning sur la cellule, un espace serait automatiquement supprimé, un Chr(160) seul ferait planter ReduceMonth
                End With
                Cells(Ligne + j, i).Value = MutY(Key)(Item)
                i = i + 1
            Next
            Cells(Ligne + j, i).Value = "=SUM(" & Cells(Ligne + j, 3).Address & ":" & Cells(Ligne + j, i - 1).Address & ")"
            j = j + 1
        Next

        'total colonnes ...........................................................................................................
        Range(Cells(Ligne + j, 3), Cells(Ligne + j, i - 1)).Formula = "=SUM(" & Cells(Ligne + 1, 3).Address & ":" & Cells(Ligne + j - 1, 3).Address & ")"
        '........................................................................................................................................

        Call TableVert(Cells(Ligne + 1, 1), Cells(Ligne + TypesMut.Count, MutY.Count + 2))
        Call TableVert(Cells(Ligne + 1, MutY.Count + 3), Cells(Ligne + TypesMut.Count, MutY.Count + 3), 200, 250, 255)
        Cells(Ligne, MutY.Count + 3).Value = "Total"
Ligne = Graphe(Ligne + TypesMut.Count + 1, Range(Cells(Ligne, 1), Cells(Ligne + TypesMut.Count + 1, MutY.Count + 2)), Range(Cells(Ligne + TypesMut.Count + 2, 3), Cells(Ligne + TypesMut.Count + 2, MutY.Count + 3)), xlColumnStacked, "recrutementsparannee")c'est que je obtient reste quelques erreurs
j'espère que vous pouvais m'aider je galère
- Messages
- 4'199
- Excel
- 2021 FR 64 bits
- Inscrit
- 13/06/2016
- Emploi
- bénévole associations Goutte d'Or
Nad89 a écrit :c'est que je obtient reste quelques erreurs
Certes, mais je ne suis pas devin. De quelles erreurs s'agit-il ??
concernant total toujours égal à 9 puis total sur tableau , comme sur figure
- Messages
- 4'199
- Excel
- 2021 FR 64 bits
- Inscrit
- 13/06/2016
- Emploi
- bénévole associations Goutte d'Or
ci-dessous correction:
        'total colonnes
         Cells(Ligne + j, 1) = "TOTAL"
        Range(Cells(Ligne + j, 3), Cells(Ligne + j, i).Formula = "=SUM(" & Cells(Ligne + 1, 3).Address(0, 0) & ":" & Cells(Ligne + j - 1, 3).Address(0, 0) & ")"
'.............Merci ca fonctionne bien mais par contre le total sur tableau 1 il deviens entre la liste comme vous voyais sur la figure dans l'ancien pub
- Messages
- 4'199
- Excel
- 2021 FR 64 bits
- Inscrit
- 13/06/2016
- Emploi
- bénévole associations Goutte d'Or
il doit y avoir un problème d'actualisation du graphique.
Vous pouvez toujours essayer cette modification
        Call TableVert(Cells(Ligne + 1, 1), Cells(Ligne + TypesMut.Count + 1, MutY.Count + 2))
        Call TableVert(Cells(Ligne + 1, MutY.Count + 3), Cells(Ligne + TypesMut.Count + 1, MutY.Count + 3), 200, 250, 255)
Après, il faudrait voir le code de la fonction "Graphe".
c'est le problème au niveau de tableau 1 je pense j'essayé mais ca toujours total est en milieu
en Fait le problème ici lorsque j'exécute tous en même temps j'obtient le tableau comme j'avais vous montré . Donc lorsque je regarde ma feuille mvt je trouve que le filtrage est appliqué , donc ce que je fais j'ai éliminé le filtrage sur ma feuille mvt puis j'exécuté que ma feuille Output donc je obtient le résultat que je veux parfait, donc c'est quoi la solution pour que tout se fait automatiquement.
Merci
- Messages
- 4'199
- Excel
- 2021 FR 64 bits
- Inscrit
- 13/06/2016
- Emploi
- bénévole associations Goutte d'Or
Bonjour,
ci-dessous modification du code pour annuler automatiquement tout filtrage sur la feuille Mvt après copie sur la feuille Output
    Dim nb_lignes_visibles  As Integer, nb_colonnes As Integer, i As Integer
    With Sheets("Mouvements")
        With .ListObjects("Tableau22")
            .Range.AutoFilter Field:=2, Criteria1:="*" 'contient quelque chose
             .Range.AutoFilter Field:=14, Criteria1:="*->*" 'contient "->"
             .Range.SpecialCells(xlCellTypeVisible).Copy Sheets("Output").Range("A7")
            nb_colonnes = .Range.Columns.Count
            nb_lignes_visibles = .Range.SpecialCells(xlCellTypeVisible).Count / nb_colonnes
            For i = 1 To nb_colonnes
                .Range.AutoFilter Field:=i  'annulation filtres
             Next i
        End With
    End With
    With Sheets("Output")
        On Error Resume Next
        .ListObjects.Add(xlSrcRange, .Range("A7").Resize(nb_lignes_visibles, nb_colonnes), , xlYes).Name = "Tableau22"
        On Error GoTo 0
        With .ListObjects(1)
            .ShowTotals = True   'affichage ligne Total
             .ListRows.Add        'ajout 1igne vierge
             Ligne = .HeaderRowRange.Row + .ListRows.Count + 3   '2ème ligne libre après tableau
        End With
End WithVOUS POUVAIS M'EXPLIQUER CA SVP
Range(Cells(Ligne + j, 3), Cells(Ligne + j, i - 1)).Formula = "=SUM(" & Cells(Ligne + 1, 3).Address & ":" & Cells(Ligne + j - 1, 3).Address & ")"pROBLEME reste avec ligne total que reviens au milieu de tableau dans tableau après filtrage
- Messages
- 4'199
- Excel
- 2021 FR 64 bits
- Inscrit
- 13/06/2016
- Emploi
- bénévole associations Goutte d'Or
Nad89 a écrit :pROBLEME reste avec ligne total que reviens au milieu de tableau dans tableau après filtrage
il doit y avoir un décalage par rapport à la cellule de copie de la feuille Output. Avec cette modification, plus de décalage possible
Dim cell_copie As Range, nb_lignes_visibles  As Integer, nb_colonnes As Integer, i As Integer

    Set cell_copie = Sheets("Output").Range("A7")
    With Sheets("Mouvements")
        With .ListObjects("Tableau22")
            .Range.AutoFilter Field:=2, Criteria1:="*" 'contient quelque chose
             .Range.AutoFilter Field:=14, Criteria1:="*->*" 'contient "->"
             .Range.SpecialCells(xlCellTypeVisible).Copy cell_copie
            nb_colonnes = .Range.Columns.Count
            nb_lignes_visibles = .Range.SpecialCells(xlCellTypeVisible).Count / nb_colonnes
            For i = 1 To nb_colonnes
                .Range.AutoFilter Field:=i  'annulation filtres
             Next i
        End With
    End With
    With Sheets("Output")
        On Error Resume Next
        .ListObjects.Add(xlSrcRange, cell_copie.Resize(nb_lignes_visibles, nb_colonnes), , xlYes).Name = "Tableau22"
        On Error GoTo 0
        With .ListObjects(1)
            .ShowTotals = True   'affichage ligne Total
             .ListRows.Add        'ajout 1igne vierge
             Ligne = .HeaderRowRange.Row + .ListRows.Count + 3   '2ème ligne libre après tableau
        End With
    End With
[quote="Nad89"]VOUS POUVAIS M'EXPLIQUER CA SVP
Range(Cells(Ligne + j, 3), Cells(Ligne + j, i - 1)).Formula = "=SUM(" & Cells(Ligne + 1, 3).Address & ":" & Cells(Ligne + j - 1, 3).Address & ")"J'ai corrigé cette instruction par celle-ci :
Range(Cells(Ligne + j, 3), Cells(Ligne + j, i)).Formula = "=SUM(" & Cells(Ligne + 1, 3).Address(0, 0) & ":" & Cells(Ligne + j - 1, 3).Address(0, 0) & ")"Application d'une formule de somme pour la ligne = Ligne +j et les colonnes 3 à i. Pour que le formule soit transposée pour chaque colonne, il est nécessaire que dans la formules les adresses soient relatives (ex: A1) et non absolues (ex: $A$1). D'où la correction du .Address en .Address(0,0).
Avec ce code je vois les totals sur graphe:
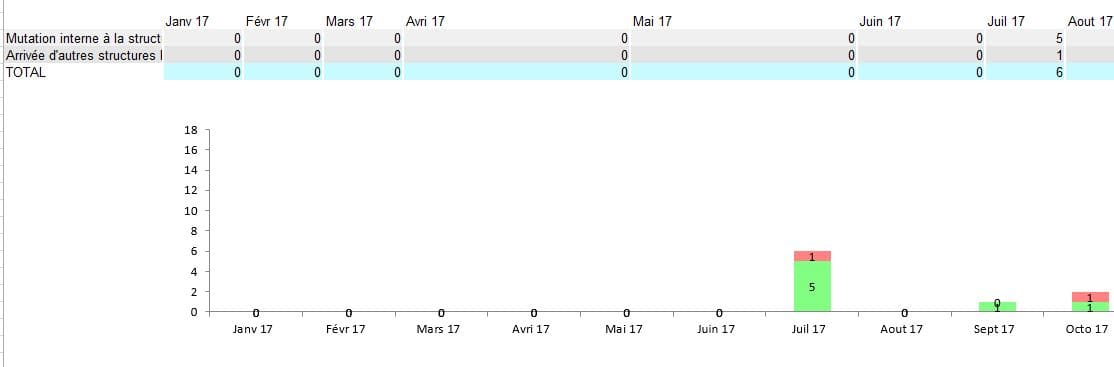
'Ligne = Graphe(Ligne + TypesMut.Count + 1, Range(Cells(Ligne, 1), Cells(Ligne + TypesMut.Count + 1, MutM.Count + 2)), Range(Cells(Ligne + TypesMut.Count + 2, 3), Cells(Ligne + TypesMut.Count + 2, MutM.Count + 3)), xlColumnStacked, "recrutementsparmois")voila resultat photo 1:
par contre je veux dans mon graphe le total ne s'affiche pas , comme avec ce code :
Ligne = Graphe(Ligne + TypesMut.Count, Range(Cells(Ligne, 1), Cells(Ligne + TypesMut.Count, MutM.Count + 2)), Range(Cells(Ligne + TypesMut.Count + 1, 3), Cells(Ligne + TypesMut.Count + 1, MutM.Count + 3)), xlColumnStacked, "recrutementsparmois")j'obtient ça :
un peu de gymnase à la main
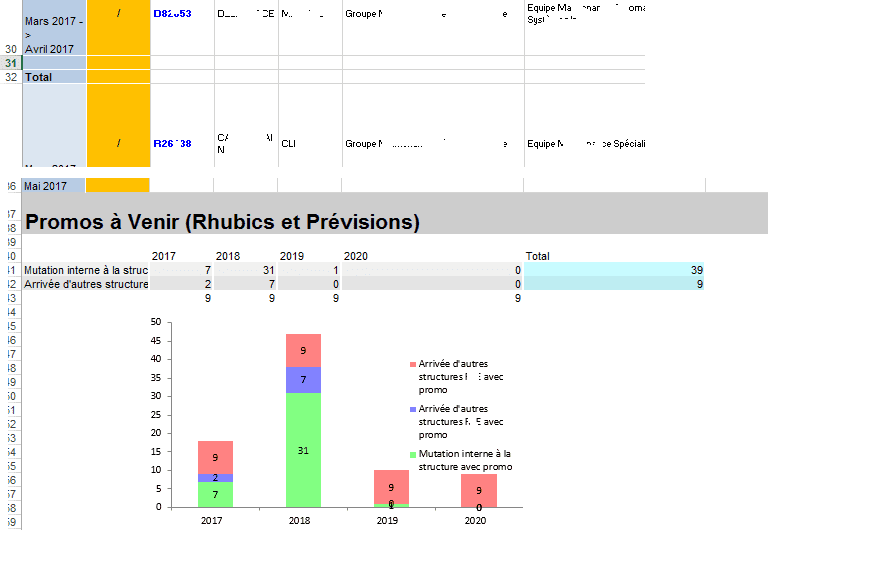
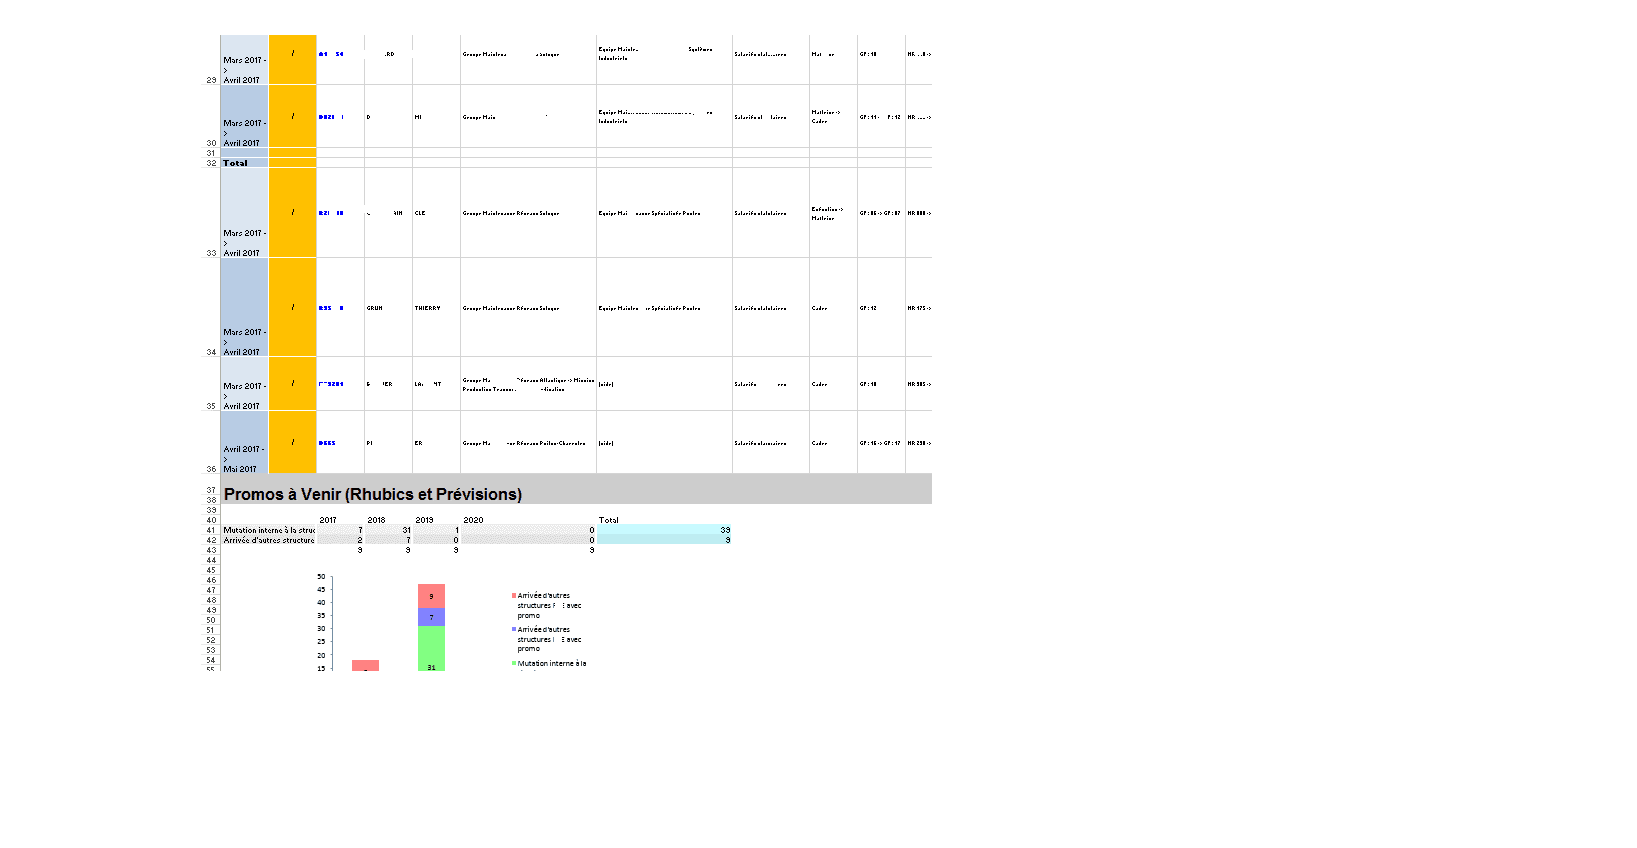
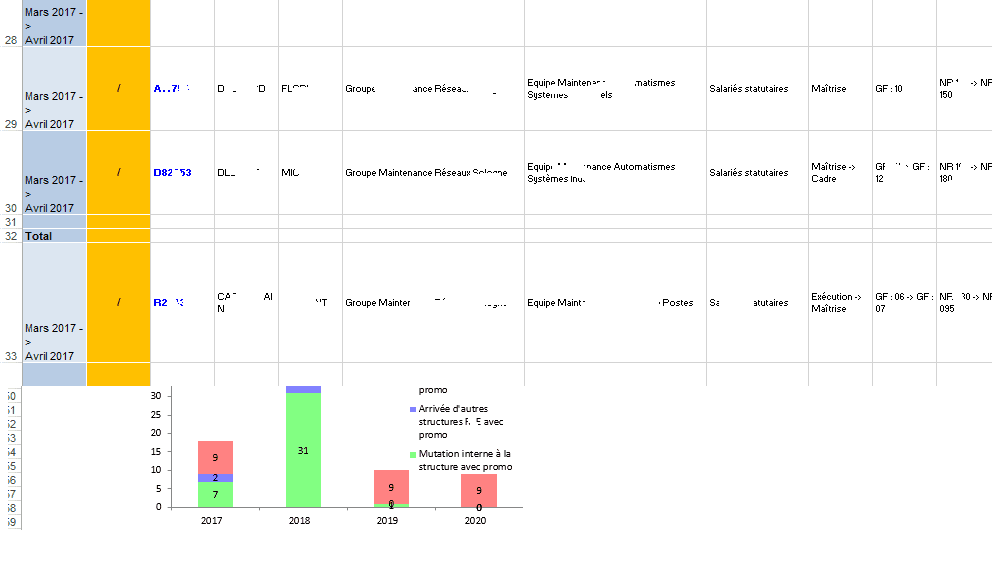
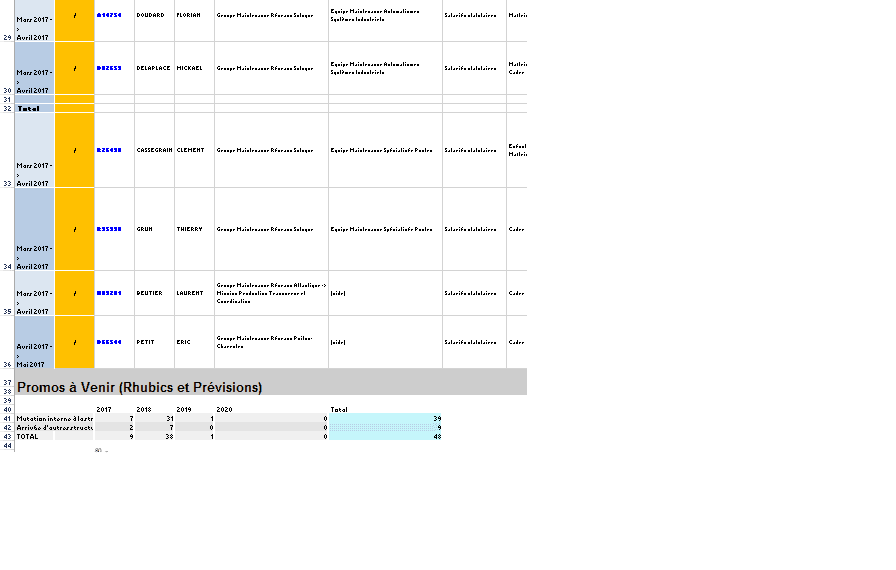
Pout total reste même problème donc mon idée de faire autre tableau en dessous pour total seulement de tel sorte je regarde par rapport aux dernier 4 caractères dans colonne 1 période je fais total pour 2016 , 2017 , voila une illustration:

j'essayé avec ce code pour décaler le graphe automatiquement
   ActiveChart.PlotArea.Select
    ActiveChart.ChartArea.Select
    ActiveSheet.Shapes("recrutementsparmois").IncrementLeft 3.75
ActiveSheet.Shapes("recrutementsparmois").IncrementTop 39.75- Messages
- 4'199
- Excel
- 2021 FR 64 bits
- Inscrit
- 13/06/2016
- Emploi
- bénévole associations Goutte d'Or
Bonsoir,
J'ai du mal à vous comprendre.
Si avec ce code,
Ligne = Graphe(Ligne + TypesMut.Count, Range(Cells(Ligne, 1), Cells(Ligne + TypesMut.Count, MutM.Count + 2)), Range(Cells(Ligne + TypesMut.Count + 1, 3), Cells(Ligne + TypesMut.Count + 1, MutM.Count + 3)), xlColumnStacked, "recrutementsparmois")la ligne "Total" ne s'affiche pas dans le graphe, il me semble que le problème est résolu !!
Je parle par rapport au tableau avec filtre le total il s'affiche au milieu des lignes, donc je veux faire un tableau composé de année et total comme j'ai déjà indiqué sur mon ancien commentaire
Faire un tableau de total pour le tableau 1 , donc je dois regarder le 4 derniers caractères dans colonne période

[attachment=0]voila.png[/attachmeunt]. Pour total sur ce tableau

- Messages
- 4'199
- Excel
- 2021 FR 64 bits
- Inscrit
- 13/06/2016
- Emploi
- bénévole associations Goutte d'Or
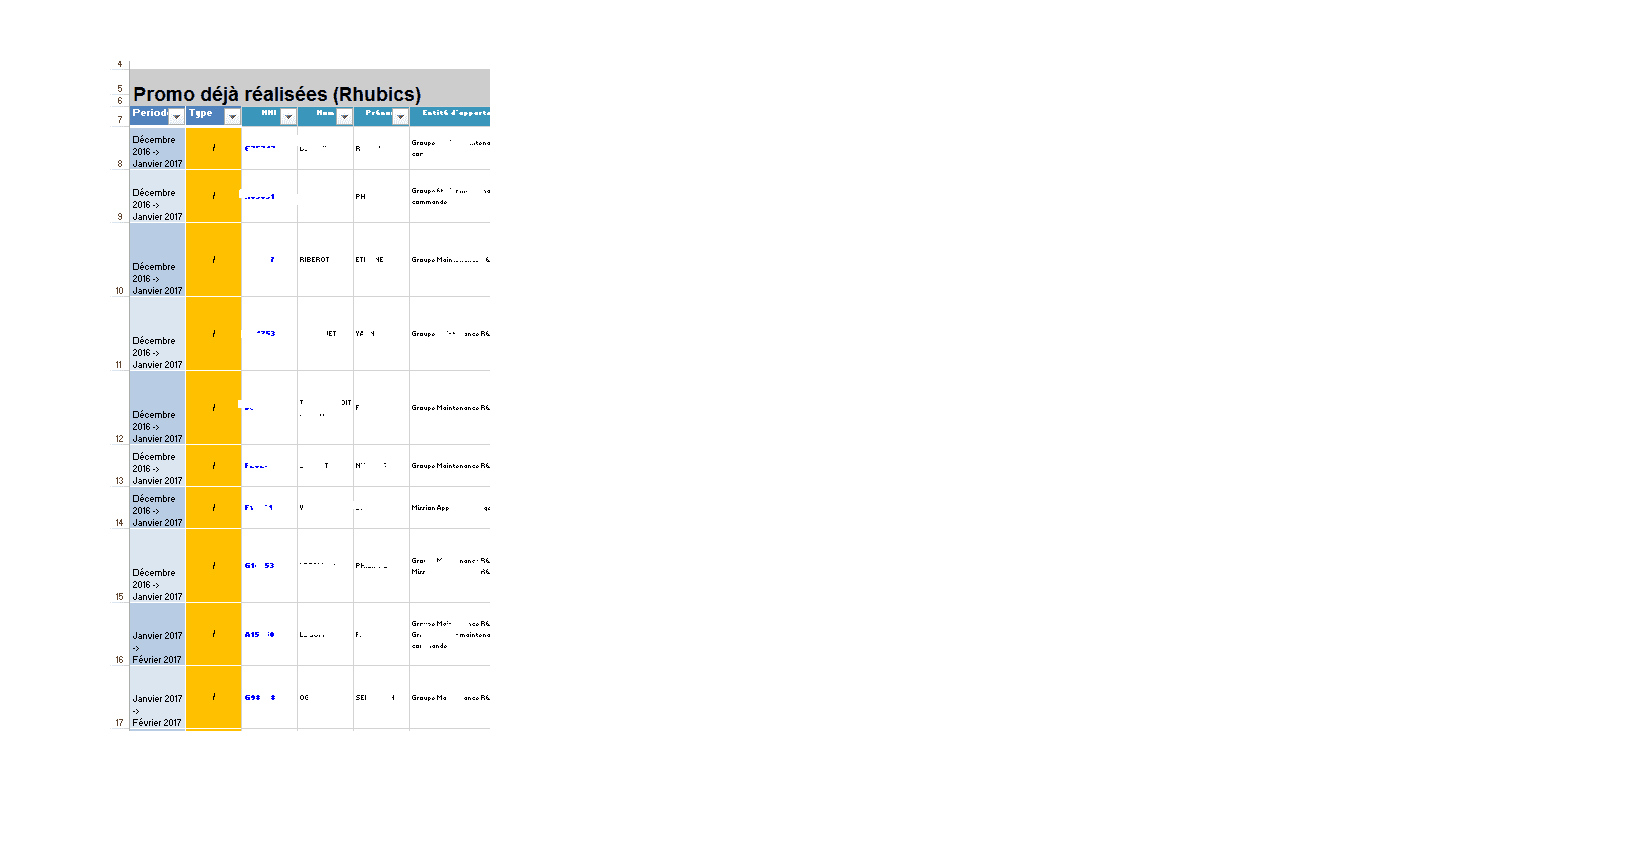
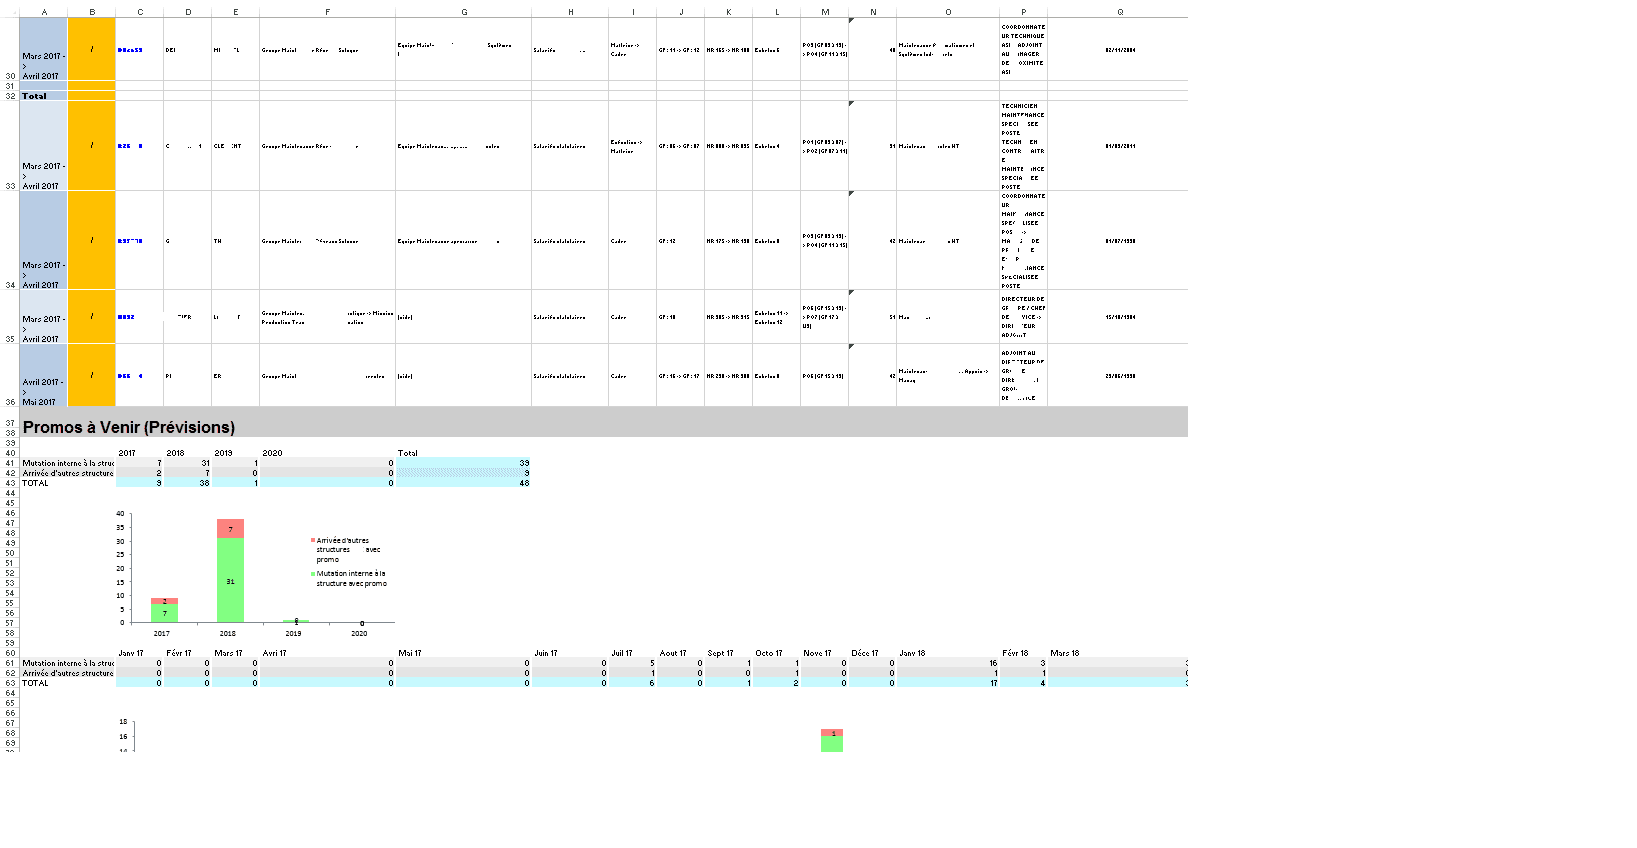
Pour pouvoir vous aider, il faut d'abord me communiquer une image plus complète marquant la différence avec celle qui paraissant aller et comportait 36 lignes, et ensuite, me redonner votre code actuel.
https://forum.excel-pratique.com/download/file.php?id=165182&mode=view

Voila deux images feuille tellement énorme j'arrive pas a prendre un imprime écran complet de tableau donc je fais deux images :
Code est :
Public Sub SuiviPromos()

    Application.EnableEvents = True

   Call SubMouvements(True)

    Dim SetNames As Scripting.Dictionary
    Dim Names As Scripting.Dictionary
    Set SetNames = ListTabs
    Set Names = ListTabs

    Dim i As Integer

    Dim Ligne As Integer, LigneSave As Integer

    Ligne = 2

    'création de la feuille "Output"
    Sheets.Add
    ActiveSheet.Name = "Output"
    Call FillWhite

    Call BigTitle("suivi des promotions réalisées et à venir ", Ligne, 1)
    Ligne = Ligne + 3

     Ligne = Ligne
        Call BigTitle("Promo déjà réalisées (Rhubics) ", Ligne, 1)
        Ligne = Ligne

   Dim nb_lignes_visibles  As Integer, nb_colonnes As Integer
    With Sheets("Mouvements")
        With .ListObjects("Tableau22")
             .Range.AutoFilter Field:=2, Criteria1:="*" 'contient quelque chose
             .Range.AutoFilter Field:=14, Criteria1:="*->*" 'contient "->"
             .Range.SpecialCells(xlCellTypeVisible).Copy Sheets("Output").Range("A7")
            nb_colonnes = .Range.Columns.Count
            nb_lignes_visibles = .Range.SpecialCells(xlCellTypeVisible).Count / nb_colonnes
            For i = 1 To nb_colonnes
                .Range.AutoFilter Field:=i  'annulation filtres
             Next i
        End With
    End With
    With Sheets("Output")
        On Error Resume Next
        .ListObjects.Add(xlSrcRange, .Range("A7").Resize(nb_lignes_visibles, nb_colonnes), , xlYes).Name = "Tableau22"
        On Error GoTo 0
        With .ListObjects(1)
            .ShowTotals = True   'affichage ligne Total
             .ListRows.Add        'ajout 1igne vierge
             Ligne = .HeaderRowRange.Row + .ListRows.Count + 3   '2ème ligne libre après tableau
        End With
    End With

    Call promoavenir(Ligne)
    Call TableauEmbauches(ThisWorkbook.Path & "\Previsions.xlsb", Ligne, 2, "", Names, "Mutation interne à la structure avec promo", ")()(", True)
    Call TableauEmbauches(ThisWorkbook.Path & "\Previsions.xlsb", Ligne, 2, "", Names, "Arrivée d'autres structures RTE avec promo", ")()(", True)
   Ligne = Ligne + 2
  ' Call TableauEmbauches(ThisWorkbook.Path & "\Previsions.xlsb", Ligne, 2, "Autres mouvements (Rhubics et Previsions)", Names, "", "Mutation", True)

    Call RenameOutput("SuiviPromos")
End Sub

Public Sub promoavenir(Ligne)

    Dim FSM As New FileSystemObject
    Dim MutY As New Scripting.Dictionary
    Dim MutM As New Scripting.Dictionary
    Dim TypesMut As New Collection

    TypesMut.Add "Mutation interne à la structure avec promo"
    TypesMut.Add "Arrivée d'autres structures  avec promo"
    PrevName = ThisWorkbook.Path & "\Previsions.xlsb"

    If SpFileExists(PrevName) Then
        Dim PrevBook As Excel.Workbook
        Application.DisplayAlerts = False
        Set PrevBook = Application.Workbooks.Open(PrevName, , , , , , , , , , , , , , xlRepairFile)
        For Each s In PrevBook.Sheets
            If s.visible = True Then
                With s
                    m = 6
                    Do While .Cells(m, 1).Value <> ""
                        Dim Merge As Range
                        Set Merge = .Cells(m, 1).MergeArea
                        date2 = .Cells(m, 1).Value
                        date1 = Mid(date2, Application.Max(1, InStrRev(date2, " ") + 1))
                        Set Rng = .Range(.Cells(Merge.Rows(1).Row, 1), .Cells(Merge.Rows(Merge.Rows.Count).Row, .Columns.Count))
                        For Each item In TypesMut
                            Call DoubleDicIncrement(MutY, date1, item, Application.WorksheetFunction.CountIf(Rng, item))
                            Call DoubleDicIncrement(MutM, date2, item, Application.WorksheetFunction.CountIf(Rng, item))
                        Next
                        m = m + Merge.Rows.Count
                    Loop
                End With
            End If
        Next
        PrevBook.Close
        Application.DisplayAlerts = True

       Ligne = Ligne + 3
        Call BigTitle("Promos à Venir (Prévisions)", Ligne, 1)
        Ligne = Ligne + 3
'Calcul total par ligne et par Année
       j = 1
        For Each item In TypesMut
            With Range(Cells(Ligne + j, 1), Cells(Ligne + j, 2))
                .Merge
                .Value = item
            End With
            i = 3
            For Each key In MutY.Keys
                With Cells(Ligne + 0, i)
                    .NumberFormat = "@"
                    .Value = ReduceMonth(key & " " & Chr(160))

               End With
                Cells(Ligne + j, i).Value = MutY(key)(item)
                i = i + 1
            Next
            Cells(Ligne + j, i).Value = "=SUM(" & Cells(Ligne + j, 3).Address & ":" & Cells(Ligne + j, i - 1).Address & ")"
            j = j + 1
        Next

        'total colonnes ...........................................................................................................

         Cells(Ligne + j, 1) = "TOTAL"
          Call TableVert(Cells(Ligne + j, 3), Cells(Ligne + j, i), 200, 250, 255)

          '..............................
         ' Application D 'une formule de somme pour la ligne = Ligne +j et les colonnes 3 à i.Pour que le formule soit transposée pour chaque colonne,
          'il est nécessaire que dans la formule les adresses soient relatives (ex: A1) et non absolues (ex: $A$1).
          'D'où la correction du .Address en .Address(0,0).
          '..............
        Range(Cells(Ligne + j, 3), Cells(Ligne + j, i)).Formula = "=SUM(" & Cells(Ligne + 1, 3).Address(0, 0) & ":" & Cells(Ligne + j - 1, 3).Address(0, 0) & ")"
        '.............
        '........................................................................................................................................

        Call TableVert(Cells(Ligne + 1, 1), Cells(Ligne + TypesMut.Count, MutY.Count + 2))
        Call TableVert(Cells(Ligne + 1, MutY.Count + 3), Cells(Ligne + TypesMut.Count, MutY.Count + 3), 200, 250, 255)
        Cells(Ligne, MutY.Count + 3).Value = "Total"
     'graphe avec total ....
       ' Ligne = Graphe(Ligne + TypesMut.Count + 1, Range(Cells(Ligne, 1), Cells(Ligne + TypesMut.Count + 1, MutY.Count + 2)), Range(Cells(Ligne + TypesMut.Count + 2, 3), Cells(Ligne + TypesMut.Count + 2, MutY.Count + 3)), xlColumnStacked, "recrutementsparannee")

'graphe sans total ....
 Ligne = Graphe(Ligne + TypesMut.Count, Range(Cells(Ligne, 1), Cells(Ligne + TypesMut.Count, MutY.Count + 2)), Range(Cells(Ligne + TypesMut.Count + 1, 3), Cells(Ligne + TypesMut.Count + 1, MutY.Count + 3)), xlColumnStacked, "recrutementsparannee")
    ActiveSheet.ChartObjects("recrutementsparannee").Activate
    ActiveChart.PlotArea.Select
    ActiveChart.ChartArea.Select
    ActiveSheet.Shapes("recrutementsparannee").ScaleHeight 0.9548611111, msoFalse, _
        msoScaleFromTopLeft
    ActiveChart.FullSeriesCollection(1).Select
    ActiveChart.PlotArea.Select
    Selection.Left = 20.915
    Selection.Top = 26.605
    Selection.Left = 20.915
    Selection.Top = 26.605
    ActiveChart.ChartArea.Select
    ActiveSheet.Shapes("recrutementsparannee").ScaleHeight 0.8945454545, msoFalse, _
        msoScaleFromBottomRight

        'copier-coller à factoriser ici

        j = 1
        For Each item In TypesMut
            With Range(Cells(Ligne + j, 1), Cells(Ligne + j, 2))
                .Merge
                .Value = item
            End With
            i = 3
            For Each key In MutM.Keys
                With Cells(Ligne + 0, i)
                    .NumberFormat = "@"
                    .Value = ReduceMonth(key & " " & Chr(160))
                    'un .NumberFormat="@" seul afficherait un warning sur la cellule, un espace serait automatiquement supprimé, un Chr(160) seul ferait planter ReduceMonth
                End With
                Cells(Ligne + j, i).Value = MutM(key)(item)
                i = i + 1
            Next
            Cells(Ligne + j, i).Value = "=SUM(" & Cells(Ligne + j, 3).Address & ":" & Cells(Ligne + j, i - 1).Address & ")"
            j = j + 1
        Next

        'total colonnes horizontal et vertical .............................................................................
        '.............................................
         Cells(Ligne + j, 1) = "TOTAL"
          Call TableVert(Cells(Ligne + j, 3), Cells(Ligne + j, i), 200, 250, 255)
        Range(Cells(Ligne + j, 3), Cells(Ligne + j, i)).Formula = "=SUM(" & Cells(Ligne + 1, 3).Address(0, 0) & ":" & Cells(Ligne + j - 1, 3).Address(0, 0) & ")"
        '........
        Call TableVert(Cells(Ligne + 1, 1), Cells(Ligne + TypesMut.Count, MutM.Count + 2))
        Call TableVert(Cells(Ligne + 1, MutM.Count + 3), Cells(Ligne + TypesMut.Count, MutM.Count + 3), 200, 250, 255)
        Cells(Ligne, MutM.Count + 3).Value = "Total"
        'graphe avect otal ....
       ' Ligne = Graphe(Ligne + TypesMut.Count + 1, Range(Cells(Ligne, 1), Cells(Ligne + TypesMut.Count + 1, MutM.Count + 2)), Range(Cells(Ligne + TypesMut.Count + 2, 3), Cells(Ligne + TypesMut.Count + 2, MutM.Count + 3)), xlColumnStacked, "recrutementsparmois")
        'graphe sans total ....
         Ligne = Graphe(Ligne + TypesMut.Count, Range(Cells(Ligne, 1), Cells(Ligne + TypesMut.Count, MutM.Count + 2)), Range(Cells(Ligne + TypesMut.Count + 1, 3), Cells(Ligne + TypesMut.Count + 1, MutM.Count + 3)), xlColumnStacked, "recrutementsparmois")

    ActiveChart.PlotArea.Select
    ActiveChart.ChartArea.Select
    ActiveSheet.Shapes("recrutementsparmois").IncrementLeft 3.75
    ActiveSheet.Shapes("recrutementsparmois").IncrementTop 39.75

       Else
        MsgBox "file does not exist"
    End If
    Set TypesEmb = Nothing
End Sub