Bonjour,
J'aimerais automatiser la création de ce graphique :
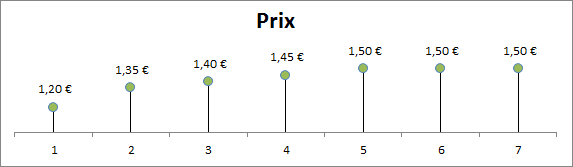
Voici le code qui correspond, j'ai un blocage au niveau des barres d'erreurs, dirigées vers le bas ... S'agit-il d'un problème de syntaxe ?
Dim ws As Worksheet
Dim rngChart As Range
Dim Ch As ChartObject
Dim min As Double, max As Double

Application.ScreenUpdating = False
Set ws = Sheets("TU")
On Error Resume Next
ws.ChartObjects(1).Delete
On Error GoTo 0

Set rngChart = ws.Cells(1).CurrentRegion
min = Application.WorksheetFunction.min(rngChart)
max = Application.WorksheetFunction.max(rngChart)
Set Ch = ws.ChartObjects.Add(200, 10, 500, 250)

With Ch.Chart
    .SetSourceData Source:=rngChart
    .ChartType = xlLineMarkers
    .Axes(xlValue).Delete
    .HasLegend = False
    .HasTitle = True
    .ChartTitle.Text = "Prix du TU"
    .SetElement (msoElementErrorBarStandardError)

    With .Axes(xlValue)
        .MinimumScale = min * 0.9
        .MaximumScale = max * 1.1
    End With

    With .SeriesCollection(1)
        .ErrorBars.Select
        .ErrorBar Direction:=xlY, Include:=xlMinusValues, Type:=xlCustom, Amount:=0
        .MarkerStyle = 8
        .MarkerSize = 8
        .Format.Fill.ForeColor.ObjectThemeColor = msoThemeColorAccent3
        .ApplyDataLabels
        .DataLabels.Position = xlLabelPositionAbove

        With .Format.Line
            .Visible = msoFalse
        End With

    End With

End With

Set Ch = Nothing
Set rngChart = Nothing
Set ws = Nothing