Automatisation via TypeScript
Bonjour
Maintenant le probleme n'est pas vraiment Excel mais TypeScript
J'ai un exercice d'excel surprenament dure, maintenant le probleme n'est pas vraiment Excel mais TypeScript, surtout que on ne peux utilise QUE TYPESCRIPT, et pas VBA par exemple
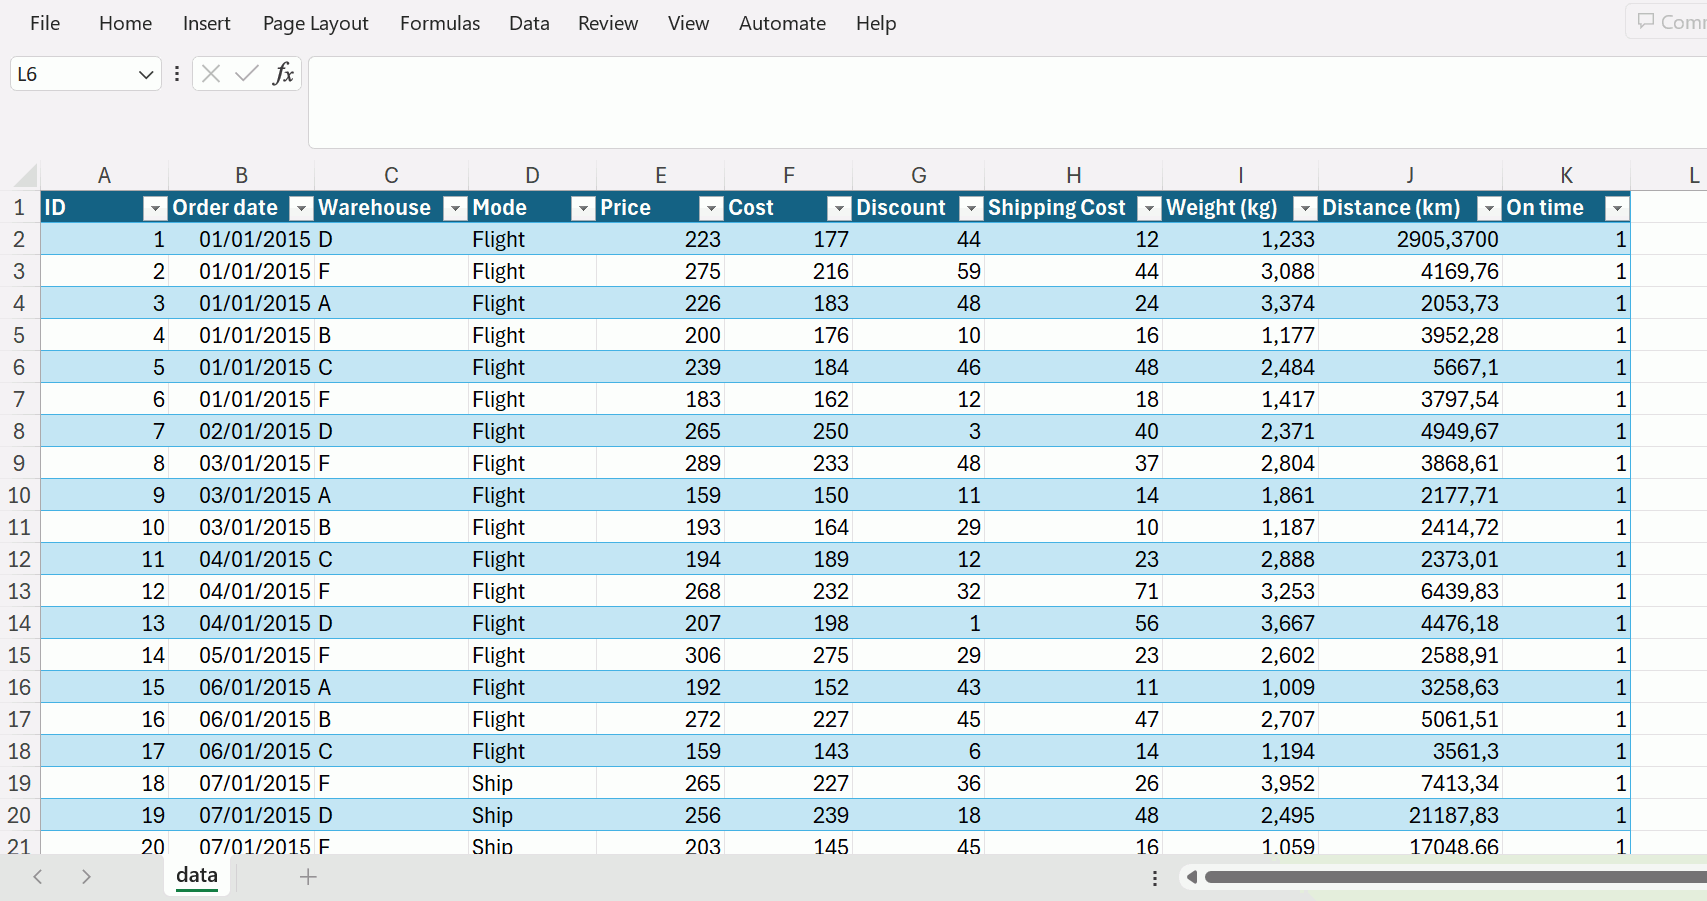
alors deja, voici le tableau de donnés: (qui s'appelle "data")
Bref voici l'exercice (oui c'est en anglais):
Le PDF dit ca pour les exercices:
You work for an online merchant as a data analyst. You have received an excel file from the accounts department which contains data on product sales over the last year. The data is contained in “exam_part2.xlsx”.
Your boss has tasked you with preparing an interactive report (in excel) on the sales data, to inform the business leadership what aspects of the business are performing well.
On a clean worksheet, create a report which answers the following questions.
Voici les 3 questions
1) [20%] Calculate the proportion of shipments which arrived on time by mode of shipment and warehouse block. Plot these in a column / bar chart.
2) [20%] Calculate the profit per transaction. Plot a time series of profit (per day) with a 4 week moving average trendline. Visually emphasise the trendline over the original series.
3) [10%] Shipping costs vary by mode of shipping and distance. Shipments by Air cost 0.00034 per kg, per km. Currently, the mode of shipping is determined based on the customers’ delivery address and customers are charged the cost of shipping.
Management are interested in introducing an “express” air freight service for all shipments currently made by ship. This would be charged at the price of 0.00036 per kg, per km.
Calculate and tabulate (i) the profit this option would have made per year on average over the data period if x% of customers would have chosen this option (instead of “Ship”), for x = 10%, 20%, 30%, 40%, 50%, 60%, 70% 80%, 90% and 100%; (ii) the percentage this (hypothetical) profit is of the average profit (without the hypothetical “express” option) per year over the data period, for the same x values.
et Voici la quatrieme (le probleme donc)
4) [50%] Write an ExcelScript which generates the report directly from the excel file given to you from the accounts department. The accounts department have committed to always providing you with an excel workbook with (only) one table which will always have the same headings (but there is no guarantee these headings will be in the same columns)
N'étant pas un programmeur, mon code est tres approximatif, et d'ailleurs retourne beaucoup d'erreures
Le voici:
```jsx
async function main(workbook: ExcelScript.Workbook) {
  const sheet = workbook.getActiveWorksheet();
  const headerRange = sheet.getRange("1:1");
  const headers = headerRange.getTexts()[0];
  const columns = getColumns(headers);

  validateColumns(columns);

  await calculateAndVisualizeOnTimeShipments(workbook, columns);
  await calculateProfitAndSummarizeByDay(workbook, columns);
  await createTimeSeriesChartWithMovingAverage(workbook);
  await analyzeExpressAirFreightOption(workbook, columns);
  await generateSummaryReport(workbook);

  console.log("All analyses have been successfully completed and the report is generated.");
}

function getColumns(headers: string[]): { [key: string]: number } {
  const requiredColumns = ["ID", "Order Date", "Warehouse", "Mode", "Price", "Cost", "Discount", "Shipping Cost", "Weight", "Distance", "On time"];
  let columns = {};
  headers.forEach((header, index) => {
    if (requiredColumns.includes(header)) {
      columns[header] = index;
    }
  });
  return columns;
}

function validateColumns(columns: { [key: string]: number }): void {
  const requiredColumns = ["ID", "Order Date", "Warehouse", "Mode", "Price", "Cost", "Discount", "Shipping Cost", "Weight", "Distance", "On time"];
  requiredColumns.forEach(column => {
    if (columns[column] === undefined) {
      throw new Error(`Column '${column}' not found.`);
    }
  });
}

async function calculateAndVisualizeOnTimeShipments(workbook: ExcelScript.Workbook, columns: { [key: string]: number }) {
  const sheet = workbook.getActiveWorksheet();
  const pivotSheet = workbook.addWorksheet("OnTimeShipmentsReport");
  const usedRange = sheet.getUsedRange();
  const pivotTable = pivotSheet.addPivotTable("PivotTableOnTimeShipments", usedRange, "A1");

  pivotTable.addHierarchy(pivotTable.getHierarchies().getItem("Warehouse"), pivotTable.getRowHierarchies());
  pivotTable.addHierarchy(pivotTable.getHierarchies().getItem("Mode"), pivotTable.getColumnHierarchies());

  const onTimeField = pivotTable.addValues(pivotTable.getHierarchies().getItem("On time"), ExcelScript.AggregationFunction.count, "Count of On time");
  onTimeField.setNumberFormat("0");

  const chart = pivotSheet.addChart(ExcelScript.ChartType.columnClustered, pivotTable.getDataBodyRange(), ExcelScript.ChartSeriesBy.columns);
  chart.setPosition("D1");
  chart.getAxes().getItem(ExcelScript.ChartAxisType.category).getTitle().setText("Proportion of On-Time Shipments");
}

async function calculateProfitAndSummarizeByDay(workbook: ExcelScript.Workbook, columns: { [key: string]: number }) {
}

async function createTimeSeriesChartWithMovingAverage(workbook: ExcelScript.Workbook) {
}

async function analyzeExpressAirFreightOption(workbook: ExcelScript.Workbook, columns: { [key: string]: number }) {
}

async function generateSummaryReport(workbook: ExcelScript.Workbook) {
}

main();

```